Why the average response time lied to us
For months our dashboard was green, and for months some customers were standing at ATMs wondering if their money had gone missing.
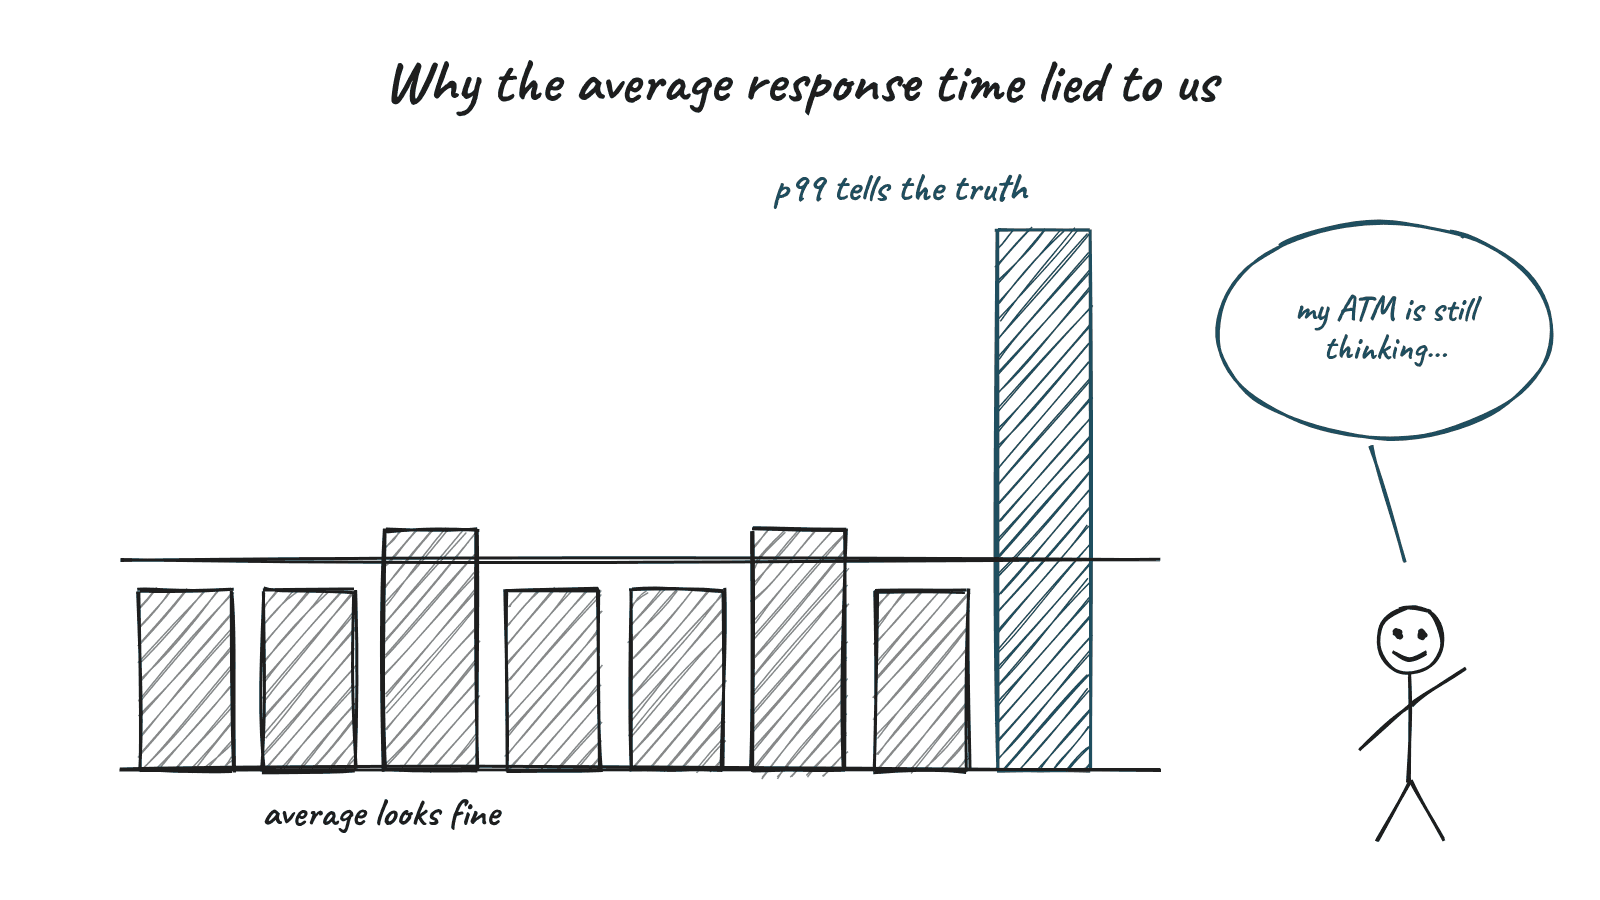
Years ago, in a payment switching team, we had a dashboard with one big green number on it. Average transaction response time. It sat comfortably under our target, week after week.
Meanwhile, the branch staff kept calling. Some ATM withdrawals were "hanging." Customers stood in front of the machine, card inside, wondering if they were about to lose their money.
The average was fine. The experience was not. Green is a very calming colour. That was the problem.
How the mean hides pain
The mean adds everything up and divides. That sounds fair, but it is very easy to fool. If ninety five transactions take 200 milliseconds and five take eight seconds, the average still looks respectable. The five slow ones get diluted by the crowd.
But those five are not abstract. Each one is a person at a machine with a queue behind them.
My data and decision course spent a good amount of time on measures of central tendency, and the lesson I took from it was simple. The mean, median and mode answer different questions. Picking one without thinking is a decision, even if it does not feel like one.
Medians and percentiles
The median tells you what a typical transaction looks like. Half are faster, half are slower. It ignores extreme values, which makes it more honest about the normal case.
Percentiles go further. The 95th or 99th percentile tells you how bad things get for the unlucky few. In payments, health tech and telco, the unlucky few are often the ones who complain loudly, and they are often right.
When we finally plotted the full distribution, the problem was obvious. There was a neat hump around 200 milliseconds and then a long, ugly tail. The tail pointed straight at a timeout setting on one downstream connection. Nobody had looked, because the average said everything was fine.
A five number habit
These days, when someone shows me a performance number, I ask for five things. The minimum, the 25th percentile, the median, the 75th percentile, and the maximum. Some people call this a five number summary. A boxplot draws it in one picture.
It takes ten seconds to read and it tells you far more than a single average. If the median and the mean are far apart, something is skewing the data. If the maximum is wild, you have a tail to chase.
It applies beyond latency
The same trap shows up everywhere. Average salary in a team. Average ticket resolution time. Average cost per user. Each one can look healthy while a meaningful group has a terrible experience.
In AI work it shows up too. An agent that gets 90 percent of tasks right "on average" might be failing every single task of one particular type. The average hides the pattern.
I still like averages, by the way. I just don't let them sit alone on a dashboard anymore. They get lonely and start telling stories.