The dashboard said deploys cause incidents
A manager once showed me proof that deploying more caused incidents. The chart was beautiful. The conclusion was wrong.
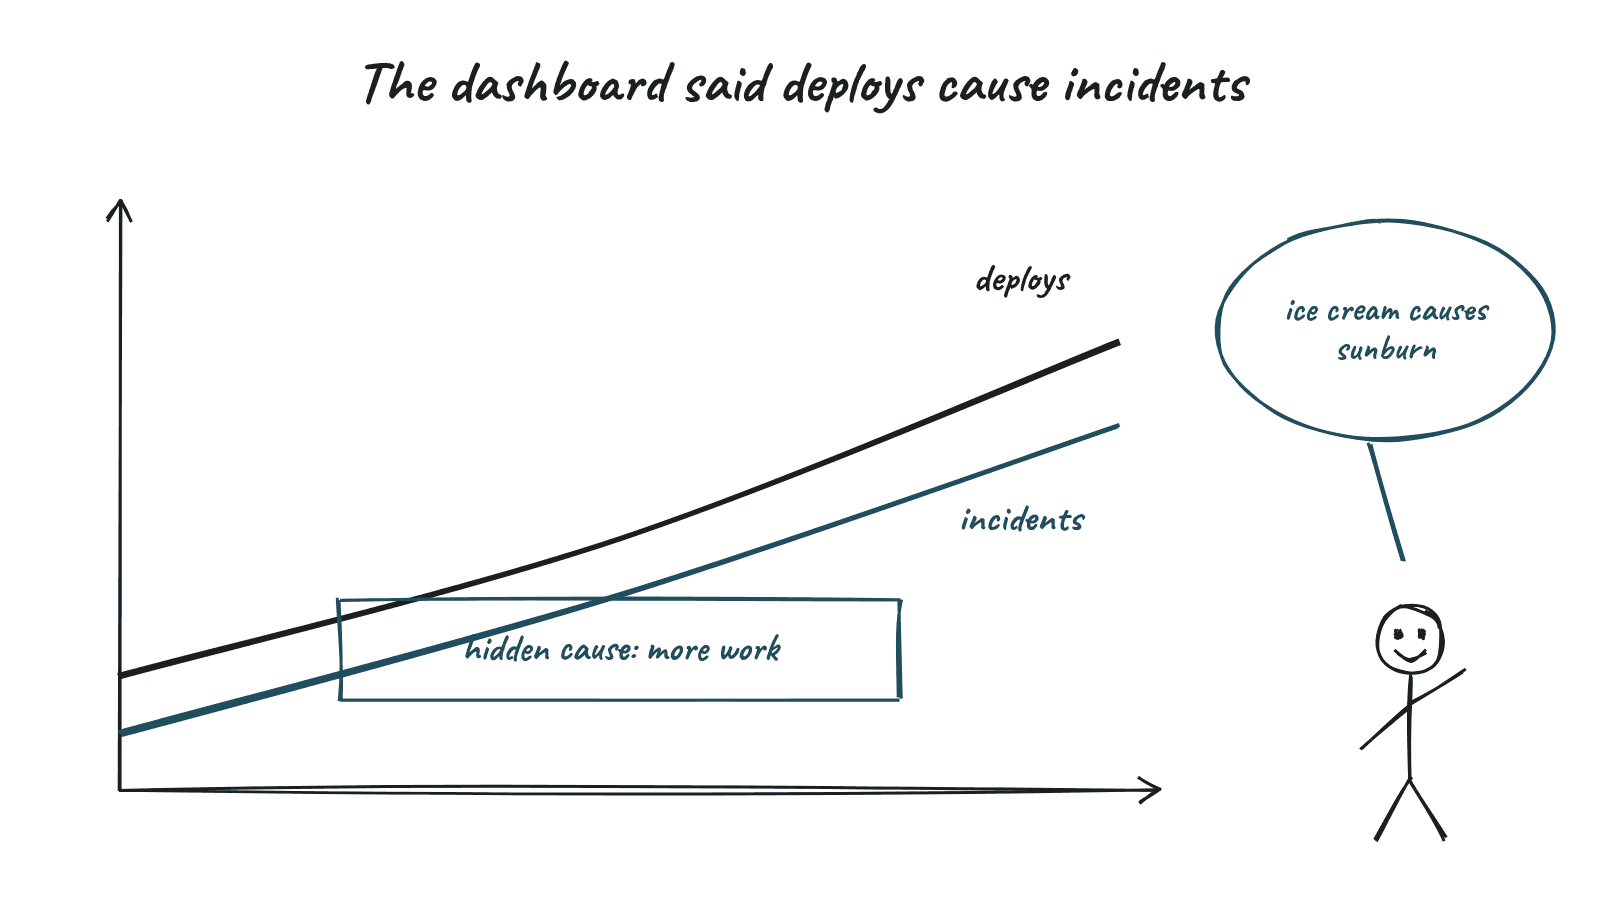
A manager once showed me a chart with real excitement. Two lines climbing together. Number of deployments per week, and number of incidents per week. "See?" he said. "Every time we deploy more, things break. We need to slow down releases."
It looked convincing. It was also probably wrong.
Correlation is a clue, not a verdict
My data and decision course hammered one idea again and again. Correlation tells you two things move together. It does not tell you that one causes the other. If two lines moving together proved anything, ice cream would be responsible for a lot of sunburn.
There are at least three other explanations worth checking before you act.
- Something else drives both. Maybe a busy season brings more feature work and more traffic. More features means more deploys. More traffic means more incidents. The deploys might be innocent.
- The arrow points the other way. Maybe incidents cause deploys, because teams push hotfixes after things break.
- It is coincidence. With enough metrics on a dashboard, some will move together by pure chance.
What we found
We dug into the incident reports. Many incidents in busy weeks were related to load, not to code changes. A fair number of deploys were actually fixes for those incidents. And the weeks with the most deploys often had the smallest, safest changes, because teams were shipping in small batches.
If we had slowed down releases, we would likely have made things worse. Bigger, less frequent releases carry more risk, not less. Anyone who has done a big bang weekend cutover in banking knows that feeling in their stomach.
Experiments beat observation
The strongest way to show causation is a controlled experiment. Change one thing, keep the rest steady, and compare. In tech we can do this more often than we think. Feature flags, canary releases and A/B tests are all small experiments.
When you cannot run an experiment, you can still be more careful. Look for confounding factors. Check timing, because causes come before effects. Segment the data. Ask whether the story still holds for different teams or services.
Charts are persuasive
The danger is that charts feel objective. A line going up looks like a fact. But the choice of which two lines to put side by side is a human choice, and it often carries a story the author already believed.
I have done this myself. I once built a slide showing that teams using a new framework had fewer bugs. It turned out those teams were also the most senior. The framework was getting credit for experience.
AI does not fix this
AI tools can now find correlations across hundreds of metrics in seconds. That is powerful and slightly dangerous. You will get more interesting looking relationships than ever before, and most will be noise. The human job of asking "why would this be true?" becomes more important, not less.
To be fair to that manager, the chart really was convincing. Most wrong charts are. That is what makes them dangerous.